July 2024 | 8 min read
Australia’s mid-year economic and investment outlook
By Grant Feng, Senior Economist, Vanguard
Markets and economy
Our latest forecasts for the Australian economy and investment returns in 2024.
| GDP Growth | Inflation* | Monetary policy** | Unemployment rate | |
| United States | 2% | 2.9% | 5.25%-5.5% | 4% |
| Canada | 1.25%-1.5% | 2.1%-2.4% | 4.25%-4.5% | 6%-6.5% |
| Mexico | 1.75%-2.25% | 3.7%-3.9% | 9.75%-10.25% | 2.5%-2.8% |
| United Kingdom | 0.7% | 2.8% | 4.75% | 4%-4.5% |
| Euro area | 0.8% | 2.2% | 3.25% | 6.5% |
| China | 5.1% | 1% | 2.3% | 5.1% |
| Australia | 1% | 3% | 4.35% | 4.6% |
*Inflation forecasts are for core inflation, which excludes volatile energy and food prices, except for Australia, where we measure headline inflation, which includes food and energy.
**Our forecast for the United States year-end monetary policy rate reflects our expected Federal Reserve federal funds target range.
Notes: Figures related to economic growth, inflation, monetary policy, and unemployment rate are Vanguard forecasts for the end of 2024.
Growth and inflation are comparisons with the end of the preceding year; monetary policy and unemployment rate are absolute levels.
Source: Vanguard, as of 25 June, 2024.
Below are our Australian economic and investment forecasts for year-end 2024.
Economic Growth (1%)
Australia’s economy eked out real GDP growth of 0.1% in the first quarter, the product of weak labour productivity that has persisted for nearly two years. We foresee growth below trend for the full year in an economy that appears to be operating near capacity despite weak demand.
Headline Inflation (3%)
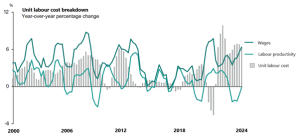
Unit labour costs are growing at a rate well above what is consistent with the 2%–3% inflation target of the Reserve Bank of Australia (RBA), contributing to an overall stickiness in inflation. We expect a slowing in the pace of rental prices and wage growth to assist disinflation, though we expect such a slowing to be gradual.
Monetary Policy (4.35%)
We expect the RBA to be one of the last developed markets central banks to cut its policy rate—which we don’t foresee happening until 2025. To break the RBA’s tolerance for weak GDP data, opening the door to policy easing, inflation will need to return to sustainable levels.
Unemployment Rate (4.6%)
The employment-to-population ratio remains near its November 2023 high, suggesting a still-tight labour market. We expect the unemployment rate to rise from its current 4.1% to around 4.6% this year as financial conditions tighten in an environment of elevated interest rates.
What I’m Watching
Elevated unit labour costs
Labour productivity has sagged since mid-2022 and wages have risen, pushing unit labour costs well above what would be consistent with the RBA’s 2%–3% inflation target. We believe the Australian economy is operating around full capacity. Given the weak productivity, a sustained period of weak demand will be needed to bring inflation down to target.
Growth, inflation, monetary policy, and unemployment figures above are Vanguard forecasts for year-end 2024. Growth and inflation are comparisons with year-end 2023; monetary policy and unemployment are absolute.
Notes: Data reflect year-over-year percentage changes of four-quarter moving averages.
Sources: Vanguard calculations using data from CEIC as of 8 June, 2024.
Australian equity and fixed income outlook
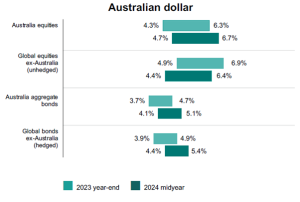
Developed markets sovereign bond yields have mostly risen since the start of the year, pushing our 10-year annualised return forecasts higher as well. Our ex-U.S. developed markets domestic equities forecasts are flat to marginally higher, though higher U.S. equities valuations have largely dragged down global equities forecasts. Forecasts are from the perspective of local investors in local currencies.
IMPORTANT: The projections and other information generated by the Vanguard Capital Markets Model regarding the likelihood of various investment outcomes are hypothetical in nature, do not reflect actual investment results, and are not guarantees of future results. Distribution of return outcomes from the VCMM are derived from 10,000 simulations for each modeled asset class. Simulations are as of 31 December, 2023, and 31 May, 2024. Results from the model may vary with each use and over time. For more information, please see the important information slide.
Note: Figures are based on a 2-point range around the 50th percentile of the distribution of return outcomes for equities and a 1-point range around the 50th percentile for fixed income.
Source: Vanguard.
Important information:
The VCMM projections are based on a statistical analysis of historical data. Future returns may behave differently from the historical patterns captured in the VCMM. More important, the VCMM may be underestimating extreme negative scenarios unobserved in the historical period on which the model estimation is based.
The Vanguard Capital Markets Model® is a proprietary financial simulation tool developed and maintained by Vanguard’s primary investment research and advice teams. The model forecasts distributions of future returns for a wide array of broad asset classes. Those asset classes include U.S. and international equity markets, several maturities of the U.S. Treasury and corporate fixed income markets, international fixed income markets, U.S. money markets, commodities, and certain alternative investment strategies. The theoretical and empirical foundation for the Vanguard Capital Markets Model is that the returns of various asset classes reflect the compensation investors require for bearing different types of systematic risk (beta). At the core of the model are estimates of the dynamic statistical relationship between risk factors and asset returns, obtained from statistical analysis based on available monthly financial and economic data from as early as 1960. Using a system of estimated equations, the model then applies a Monte Carlo simulation method to project the estimated interrelationships among risk factors and asset classes as well as uncertainty and randomness over time. The model generates a large set of simulated outcomes for each asset class over several time horizons. Forecasts are obtained by computing measures of central tendency in these simulations. Results produced by the tool will vary with each use and over time.
This article contains certain ‘forward looking’ statements. Forward looking statements, opinions and estimates provided in this article are based on assumptions and contingencies which are subject to change without notice, as are statements about market and industry trends, which are based on interpretations of current market conditions. Forward-looking statements including projections, indications or guidance on future earnings or financial position and estimates are provided as a general guide only and should not be relied upon as an indication or guarantee of future performance. There can be no assurance that actual outcomes will not differ materially from these statements. To the full extent permitted by law, Vanguard Investments Australia Ltd (ABN 72 072 881 086 AFSL 227263) and its directors, officers, employees, advisers, agents and intermediaries disclaim any obligation or undertaking to release any updates or revisions to the information to reflect any change in expectations or assumptions.
© 2024 Vanguard Investments Australia Ltd. All rights reserved.


