

Invest with perspective
By Vanguard
Investing strategy
The biggest market events of the past 30 years had one thing in common: few saw them coming
If you could go back 30 years and invest with the benefit of hindsight, many decisions would seem obvious.
You would know when to avoid the dot-com crash, how to navigate the Global Financial Crisis and when markets would recover from the COVID-19 pandemic. You would know that terrorist attacks, wars, political upheaval and periods of surging inflation would eventually give way to recovery. You would know which asset classes would perform best and which headlines would prove less important than they first appeared.
But real investing doesn’t work that way. The challenge for investors is making decisions in the face of uncertainty, without knowing what comes next.
That’s what makes a long-term perspective so valuable. While uncertainty is an inherent part of investing, a well-considered plan, in line with your financial situation, needs and tolerance for risk, can help investors stay focused on their goals and make informed decisions through changing market conditions.
What 30 years of market history can teach us
Vanguard’s Index Chart brings together three decades of market performance in a single view, showing how different asset classes have performed through periods of growth, disruption and recovery.
While investment returns varied across asset classes and markets experienced periods of volatility, the chart shows how investors who remained invested over the period shown participated in long-term market growth.
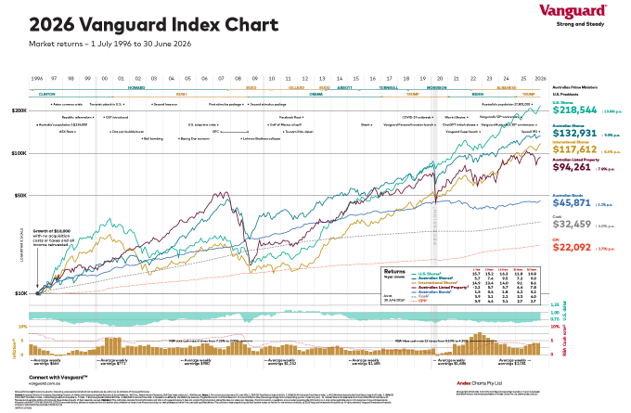
How different asset classes have performed
A long-term perspective
| Asset class | Average annual return since 1 July 1996 (%) |
Value at 30 June 2026 of $10,000 invested on 1 July 1996 |
| U.S. Shares1 | 10.8 | $218,544 |
| Australian Shares2 | 9.0 | $132,931 |
| International Shares3 | 8.6 | $117,612 |
| Australian Listed Property4 | 7.8 | $94,261 |
| Australian Bonds5 | 5.2 | $45,871 |
| Cash6 | 4.0 | $32,459 |
Data as of 30 June 2026. Sources: Bloomberg Finance L.P., MSCI Inc., Standard & Poor’s, WM Reuters. ¹ S&P 500 Total Return Index (AUD), ² S&P/ASX All Ordinaries Total Return Index, ³ MSCI World ex-Australia Net Total Return Index (AUD), ⁴ S&P/ASX 200 A-REIT Total Return Index, ⁵ Bloomberg AusBond Composite 0+ Yr Index, ⁶ Bloomberg AusBond Bank Bill Index.
This example is illustrative only and is based on the factors stated. It should not be taken to contain or provide an estimate or forecast of future investment performance. Any past performance information is given for illustrative purposes only and should not be relied upon as, and is not, an indication of future performance.
Average annual return (% p.a.) to 30 June 2026
| Asset class | 1 year | 5 years | 10 years | 20 years | 30 years |
| U.S. shares¹ | 15.7 | 15.2 | 16.3 | 11.8 | 10.8 |
| Australian shares² | 5.7 | 7.4 | 9.5 | 7.2 | 9.0 |
| International shares³ | 14.9 | 13.4 | 14.0 | 9.1 | 8.6 |
| Australian listed property⁴ | -2.2 | 5.7 | 5.7 | 4.4 | 7.8 |
| Australian bonds⁵ | 1.5 | 0.4 | 1.8 | 4.2 | 5.2 |
| Cash⁶ | 3.9 | 3.1 | 2.2 | 3.3 | 4.0 |
Data as of 30 June 2026. Sources: Bloomberg Finance L.P., MSCI Inc., Standard & Poor’s, WM Reuters. ¹ S&P 500 Total Return Index (AUD), ² S&P/ASX All Ordinaries Total Return Index, ³ MSCI World ex-Australia Net Total Return Index (AUD), ⁴ S&P/ASX 200 A-REIT Total Return Index, ⁵ Bloomberg AusBond Composite 0+ Yr Index, ⁶ Bloomberg AusBond Bank Bill Index.
Any past performance information is given for illustrative purposes only and should not be relied upon as, and is not, an indication of future performance.
Beyond showing the constant ups and downs of investment markets over time, the Vanguard Index Chart shows how a starting balance of $10,000 would have grown in value over 30 years after hypothetically being invested into the indexes which track each asset class.
An index benchmark is a list of securities, like shares or bonds, representing the whole market or a segment of the market.
While it is not possible to invest in an index itself, there are exchange-traded funds (ETFs) that have been designed to track the returns of these specific indexes.
An index fund attempts to replicate an index as closely as possible by investing in the securities that comprise the index. So, when you invest in the “whole market” through broad-based diversified index funds and ETFs, you gain exposure to the growth of local and global economies.
The bigger picture
One of the clearest messages from the Index Chart is that investing outcomes are often shaped by time.
While no investment is guaranteed to generate positive returns, and all investments carry risk, a long-term perspective can help investors avoid becoming overly focused on short-term market movements.
The chart also highlights why diversification matters. Different asset classes perform differently over time, making it difficult to predict which will lead in any given year.
Diversification can help investors manage risk by spreading investments across different markets and asset classes. While this may reduce reliance on any single source of returns, it does not remove the risk of investment loss.
The past three decades remind us that uncertainty is a normal part of investing. Markets will continue to experience setbacks, surprises and periods of volatility.
The challenge isn’t predicting what happens next. It’s maintaining the discipline to stay focused on the bigger picture when uncertainty arrives.
Long-term investors can benefit from keeping this perspective in mind.