

Putting the 2026 drawdown in context
By Kevin Khang, Vanguard Senior Global Economist
Markets and economy
A recent market dip was mild by history, offering perspective on risk and resilience
The rhetoric around the conflict in the Middle East has been intense, energy supply disruptions, oil futures prices in triple digits, and comparisons to 1970s stagflation. But the equity market damage has proved short-lived.
From the S&P 500 Index’s January 27 closing price peak of 6,978 to the March 30 closing trough of 6,343, the index fell about 9%. It has since regained all of that decline as negotiations to end the conflict continue.
Since 1950, the S&P 500 has experienced 32 distinct drawdowns of at least 9%. These drawdowns averaged from as few as 61 days peak-to-trough in the 1990s to as many as 653 days in the 2000s,the decade flanked by the dot-com meltdown and the global financial crisis. Compared to these benchmarks, the current episode sits on the shallow end.
But even a mild drawdown can offer an opportunity to reflect on broader considerations, for two primary reasons.
First, every drawdown is a useful stress test
However modest, the discomfort investors feel during a decline reveals something about their risk tolerances, which is information that a calm market simply does not provide. If a 9% dip prompted portfolio reviews, hedging activity, or restless nights, that’s meaningful insight, not because this drawdown was particularly dangerous, but because the emotional signal it provides can help investors tailor portfolio allocations to their comfort zones.
An anatomy of drawdowns, by decade
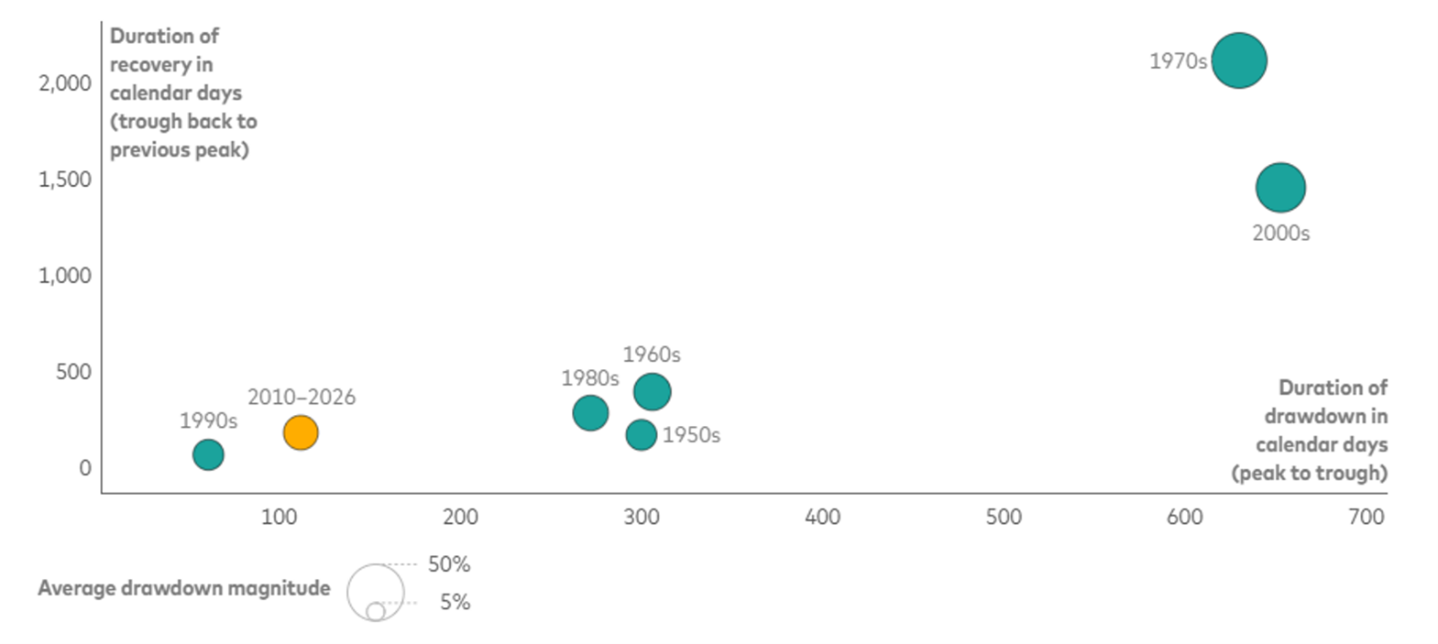
Notes: Each dot represents the average duration of drawdowns of at least 9% and their recoveries, measured in calendar days, during respective decades. Percentages reflect price-only declines in the level of the Standard & Poor’s 500 Index (or the S&P 90 Index prior to April 1957), ignoring dividend payments. Average drawdown magnitudes are percentages.
Past performance is not a guarantee of future results. The performance of an index is not an exact representation of any particular investment, as you cannot invest directly in an index.
Sources: Vanguard calculations, based on index returns from Bloomberg, as of April 13, 2026.
Second, the post-2010 era has been an unusually friendly environment for equity investors
In the past 15 years, investors have experienced eight drawdowns. The S&P 500 returned to previous peaks within a year in most of those cases. No drawdown lasted more than 25 months. Formative investing experiences limited to this period may understandably be calibrated to that rhythm. The accompanying chart is a gentle reminder that other decades have looked quite different. The 2000s produced just three drawdowns, for example, but they averaged 653 days peak-to-trough and required nearly 1,500 days to recover. Long-term equity investors should keep that history in mind even though the current environment feels manageable.
An opportunity for perspective
It may be worth using moments like this to think ahead. What would an extended drawdown like the average one seen in the 2000s, about two years to the bottom and another four years to recover,mean for portfolios, income needs, and investment horizons? Those durations can exceed typical planning assumptions and test staying power in ways the past 15 years have not. Even a simple what-if exercise along those lines can surface useful insights. The current environment, while benign, offers a natural moment to reflect.
Notes: All investing is subject to risk, including possible loss of principal.