

Most active managers struggled to beat the market in the first half of 2026
By Vanguard
Investing strategy
Markets and economy
Mid-year SPIVA data shows the majority of active equity managers underperformed their benchmark, highlighting the challenge of consistently outperforming the market.
The first half of 2026 appeared to be a favourable environment for active fund managers. Differences in returns across sectors and individual stocks created opportunities for managers to outperform the broader market.
Yet the latest SPIVA (S&P Indices Versus Active) Australia Mid-Year 2026 Scorecard found that most active equity managers still struggled to outperform their benchmarks.
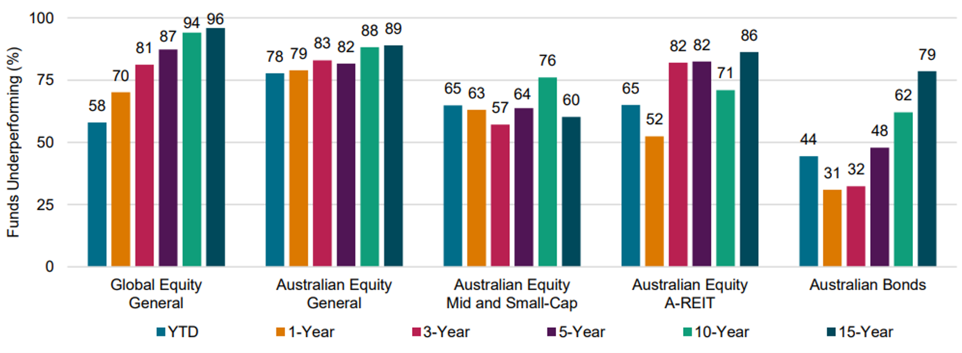
Among Australian Equity General funds, 78% underperformed the S&P/ASX 200 Index during the six months to 30 June 2026. The first-half underperformance rate was among the highest recorded for the category since SPIVA began tracking it in 2013.
Global equity managers faced similar challenges. Despite having a broad range of investment opportunities, 58% of Global Equity General funds lagged the S&P World Index in the first half of the year.
Over longer time horizons, the challenge proved even greater, with most active managers failing to beat the market over 15 years.
Investors often hear about fund managers who outperform the market. What receives less attention is how difficult it is to deliver that outperformance consistently over time.
Exibit 1: Percentage of Underperforming Active Australian Funds
Source: S&P Dow Jones Indices LLC, Morningstar. Data as of June 30, 2026. The S&P World Index (AUD) was launched May 28,2020. The S&P/ASX Mid-Small was launched July 29, 2011. The S&P/ ASX Australian Fixed Interest 0+ Index (Legacy) was launched Feb 13, 2025. See the appendix for more details on benchmarks used. All data prior to such date is back-tested hypothetical data. Past performance is no guarantee of future results. Chart is provided for illustrative purposes and reflects hypothetical historical performance. please see the Performance Disclosure at the end of this document for more information regarding the inherent limitations associated with back-tested performance.
Note: The example is illustrative only and is based on the factors stated. It should not be taken to contain or provide an estimate of actual returns.
Mid-year highlights
- Global Equity General Funds: Global markets experienced significant shifts in the first half of 2026, with U.S. equities lagging other regions and the U.S. dollar weakening sharply. Even with these opportunities, 58% of actively managed global equity funds underperformed the S&P World Index. The challenge became even more apparent over longer periods, with 87%, 94% and 96% of funds underperforming over the five-, 10- and 15-year periods, respectively.
- Australian Equity General Funds: Australian shares delivered modest gains in the first half of 2026, with the S&P/ASX 200 Index rising 2.4%. However, most active managers struggled to keep pace, with 78% of Australian equity funds underperforming the benchmark over the period. Over the 15-year period, 89% of funds failed to beat the benchmark.
- Australian Equity Mid-and Small-Cap Funds: As the S&P/ASX Mid-Small Index declined 5.9% in the first half of 2026, Australian Equity Mid- and Small-Cap funds posted an asset-weighted average return of -8.7%, with nearly two-thirds of funds (65%) underperforming the benchmark. Over the longer term, results remained somewhat more favourable than broad Australian equity funds, although 76% of funds still underperformed over the past decade.
- Australian Equity A-REIT Funds: The S&P/ASX 200 A-REIT Index fell 5.2% in the first half of 2026. Australian Equity A-REIT funds posted an asset-weighted average return of -5.6%, with 65% of funds underperforming the benchmark. Long-term results remained challenging, with 86% of funds underperforming over the 15-year period.
- Australian Bonds Funds: Active bonds managers delivered stronger relative results than their equity counterparts in the first half of 2026. The average fund returned 2.4% on an asset-weighted basis, compared with 2.3% for the S&P/ASX iBoxx Australian Fixed Interest 0+ Index. Even so, 44% of funds underperformed the benchmark, while long-term results remained challenging, with 79% of funds underperforming over the 15-year period.
Growth in ETFs reflects the shift towards index investing
While active management can play an important role in portfolio construction, the latest SPIVA data highlights how difficult it can be to consistently outperform the market over time. Against this backdrop, Australia’s ETF market continued to grow strongly in 2026, with ASX-listed ETF assets reaching $371.5 billion in August, up 28% year-on-year.1 “Together, these trends highlight the increasing appeal of low-cost, diversified index strategies which allow investors to gain broad market exposure without relying on the ability to identify future outperformers,” said Vanguard Australia’s Head of Equity Product, Tom Wilson.
- ASX Investment Products report, August 2026
Important Information:
Backtested performance is NOT an indicator of future actual results. The results reflect performance of a strategy not historically offered to investors and do NOT represent returns that any investor actually attained. Backtested results are calculated by the retroactive application of a model constructed on the basis of historical data and based on assumptions integral to the model which may or may not be testable and are subject to losses.
General assumptions include: The investor would have been able to purchase the securities recommended by the model and the markets were sufficiently liquid to permit all trading. Changes in these assumptions may have a material impact on the backtested returns presented. Certain assumptions have been made for modeling purposes and are unlikely to be realised. No representations and warranties are made as to the reasonableness of the assumptions. This information is provided for illustrative purposes only.
Backtested performance is developed with the benefit of hindsight and has inherent limitations. Specifically, backtested results do not reflect actual trading or the effect of material economic and market factors on the decision-making process. Since trades have not actually been executed, results may have under- or over-compensated for the impact, if any, of certain market factors, such as lack of liquidity, and may not reflect the impact that certain economic or market factors may have had on the decision-making process. Further, backtesting allows the security selection methodology to be adjusted until past returns are maximised. Actual performance may differ significantly from backtested performance. Backtested results are adjusted to reflect the reinvestment of dividends and other income and, except where otherwise indicated, are presented net of estimated transaction costs and do not include the effect of management fees. No cash balance or cash flow is included in the calculation.
Actual results could differ materially from those referred to in the above statements. In particular, distributions and capital growth are not guaranteed. An investment in S&P Indices Active Funds is subject to investment and other known and unknown risks, some of which are beyond the control of the author, including possible delays in repayment and loss of income and principal invested. Neither Vanguard Investments Australia Ltd (ABN 72 072 881 086 AFSL 227263) nor its related entities, directors or officers give any guarantee as to the success of the indices, amount or timing of distributions, capital growth or taxation consequences of investing in the S&P Indices Active Funds.
The S&P Indices Active Funds referred to in this article are provided by S&P Dow Jones LLC, Morningstar. Vanguard Investments Australia Ltd (ABN 72 072 881 086 AFSL 227263) (VIA) does not act as an agent or representative of S&P Dow Jones LLC, Morningstar and accepts no responsibility or liability for any representation, act or omission in relation to the funds referred to in this article.
Past performance information is given for illustrative purposes only and should not be relied upon as, and is not, an indication of future performance. The results relate to funds included in the S&P Indices Active Funds Australia Scorecard and do not represent the performance of any Vanguard product. Index returns do not take account of fees or costs. The results may differ if alternative benchmarks, fund classifications, time periods or survey populations are used. Refer to the S&P DJI scorecard for the methodology, fund population and treatment of relevant fees and fund closures.
Source: S&P Dow Jones Indices LLC, SPIVA Australia Mid-Year 2026 Scorecard.